Global Nylon 6 and Nylon 6,6 Market: Prices, Regions, Applications, Outlook 2026
Global Nylon 6 and Nylon 6,6 market
Nylon 6 Value Chain Economics (2026)
🧪 Simplified Cost Chain (Indicative Global Averages)
1. From Benzene → Caprolactam → Nylon 6
| Stage | Cost ($/ton) | Notes |
|---|---|---|
| Benzene | 900–1,050 | Oil-linked, volatile |
| Cyclohexane | 1,050–1,200 | Hydrogenation step |
| Caprolactam (CPL) | 1,400–2,400 | Strong regional spread |
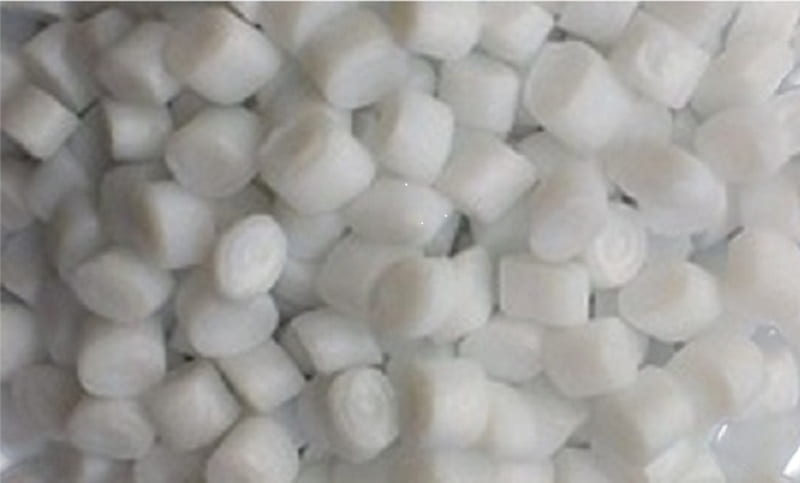
| Nylon 6 chips | 1,500–2,800 | Oversupply in Asia |
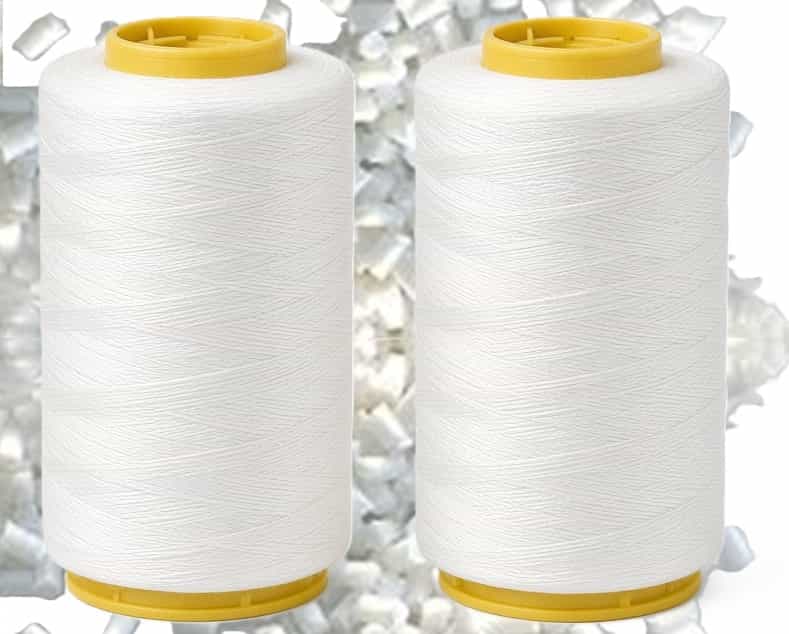
| Filament yarn (DTY) | 1,800–3,200 | Highly commoditized |
📉 Margin Structure (2026 Reality)
| Segment | Margin מצב |
|---|---|
| Caprolactam | ⚠️ Weak (China oversupply) |
| Nylon 6 polymer | ⚠️ Compressed |
| Textile yarn | 🔴 Very low |
| Engineering plastics | 🟢 Strong |
👉 Key insight:
Profit pool has shifted downstream → compounds & engineering applications
🏭 Global Capacity Map (Approximate 2026)
Nylon 6 (PA6)
| Region | Capacity (Mt/year) | Share |
|---|---|---|
| China | ~10–11 Mt | ~55% |
| Europe | ~3 Mt | ~15% |
| North America | ~2 Mt | ~10% |
| Rest of Asia | ~3–4 Mt | ~20% |
Nylon 6,6 (PA66)
| Region | Capacity (Mt/year) | Notes |
|---|---|---|
| North America | ~1.5–2 Mt | Strong integration |
| Europe | ~1 Mt | Declining competitiveness |
| China | ~1–1.2 Mt | Expanding fast |
| Rest of World | ~0.5 Mt | Limited |
🧪 Caprolactam (Key Bottleneck)
- Global capacity: ~9–10 Mt
- China share: ~60%+
👉 Structural issue:
Too much CPL + PA6 capacity in China → global price pressure
📦 Segment Profitability (2026 Snapshot)
| Segment | Margin | Outlook |
|---|---|---|
| Textile filament (POY/DTY/FDY) | 🔴 2–5% | Structural overcapacity |
| Staple fiber | 🟡 5–8% | Stable |
| BCF (carpets) | 🟡 8–12% | US-driven demand |
| Engineering plastics | 🟢 15–25% | Strong growth |
| Compounds (glass-filled etc.) | 🟢 20–35% | Highest value |
🚗 Demand Shift (Critical Structural Change)
Then (pre-2015):
- Textile = dominant profit driver
Now (2026):
- Textile = volume but low margin
- Engineering plastics = profit engine
🔮 Pricing Outlook (2026–2030)
Scenario Framework
🟢 Bull Case
- Strong EV growth
- Capacity rationalization in China
👉 Nylon prices ↑ 10–20%
🟡 Base Case (Most Likely)
- Textile weak
- Engineering plastics strong
👉 Prices stable with regional divergence
🔴 Bear Case
- China exports surge
- Global demand slowdown
👉 Prices ↓ 10–15%
🌏 Regional Pricing Logic
| Region | Price Level | Why |
|---|---|---|
| China | Lowest | Overcapacity |
| Europe | Mid–high | Energy costs |
| USA | Highest | Supply discipline |
👉 Expect:
Persistent arbitrage flows (China → Europe)
⚙️ Engineering Plastics Growth (Key Opportunity)
Applications driving demand:
- EV battery modules
- Connectors & electronics
- Lightweight structural parts
Why Nylon 6,6 wins:
- Higher temperature resistance
- Better mechanical strength
🧭 Strategic Positioning (2026 Reality)
Winners:
- Integrated players (CPL → polymer → compounds)
- Engineering plastics specialists
- US-based producers (pricing power)
Losers:
- Textile-focused producers
- Standalone CPL producers (especially in China)
- Europe commodity polymer players
📊 Key Strategic Insight
👉 The nylon industry has split into two different businesses:
1. Commodity Chain
- CPL → PA6 → yarn
- High volume, low margin
- China-dominated
2. Specialty Chain
- PA6/PA66 → compounds → engineering parts
- Lower volume, high margin
- Technology-driven
✅ Final Takeaway
- Do NOT evaluate nylon as one market anymore
- It is now:
- Commodity petrochemical (textiles)
- Advanced materials (engineering plastics)
Nylon 6 and Nylon 6.6 market in Europe 2026: Prices, Demand, and Competition from Asia
More…