BASF Q1 2026 results show resilience amid global pressure challenges – Polymer Price Trends
BASF Q1 2026 results – Full price table (27/04/2026 →04/05/2026)
| ITEM | 27/04/2026 | 04/05/2026 | +/− |
|---|---|---|---|
| Bottle grade PET chips domestic market | 8,850 yuan/ton | 9,200 yuan/ton | +350- |
| Chinese bottle-grade PET chips FOB export price | 1,200 $/ton | 1,270 $/ton | +70- |
| LDPE CFR Est China | 1,100 $/ton | 1,230 $/ton | +130- |
| PET Semidull — Fiber chips | 7,650 yuan/ton | 7,800 yuan/ton | +150- |
| PET Bright — Fiber chips | 7,850 yuan/ton | 7,960 yuan/ton | +110- |
| Pure Terephthalic Acid PTA domestic market | 6,670 yuan/ton | 6,925yuan/ton | +55- |
| Pure Terephthalic Acid PTA FOB China | 840 $/ton | 920 $/ton | +80- |
| Monoethyleneglycol (MEG) South China | 5,350 yuan/ton | 5,300 yuan/ton | -50- |
| Monoethyleneglycol (MEG) CFR China | 620 $/ton | 645 $/ton | +25- |
| Paraxylene PX FOB Taiwan market | 1,208 $/ton | 1,244 $/ton | +36- |
| Paraxylene PX FOB South-Korea market | 1,209 $/ton | 1,245 $/ton | +36- |
| Paraxylene PX FOB EU market | 1,301 $/ton | 1,271 $/ton | -30- |
| Polyester filament POY 150D/48F domestic market | 8,600 yuan/ton | 8,600 yuan/ton | — |
| Recycled Polyester filament POY 150/48F domestic market | 7,400 yuan/ton | 7,400 yuan/ton | — |
| Polyester filament DTY 150D/48F domestic market | 9,800 yuan/ton | 9,800 yuan/ton | — |
| Polyester filament FDY 68D/24F | 9,600 yuan/ton | 9,600 yuan/ton | — |
| Polyester filament FDY 150D/96F domestic market | 8,950 yuan/ton | 8,950 yuan/ton | — |
| Polyester staple fiber 1.4D 38mm domestic market | 8,250 yuan/ton | 8,360 yuan/ton | +110- |
| Caprolactam (CPL) domestic market | 12,600 yuan/ton | 12,350 yuan/ton | -250- |
| Caprolactam (CPL) CFR China | 1,600 $/ton | 1,630 $/ton | -+30- |
| Nylon 6 chips overseas market |
North America $4.25 $4,250 Europe $2.65 $2,650 Middle East $2.27 $2,270 Southeast Asia $2.16 $2,160 Northeast Asia $1.99 $1,990 |
America$4.25 Europe$2.65 Middle East$2.27 Southeast Asia$2.16 Northeast Asia$1.99 |
— |
| Nylon 6 chips conventional spinning domestic market | 12,900 yuan/ton | 12,800 yuan/ton | -100- |
| Nylon 6 chips high speed spinning domestic market | 13,800 yuan/ton | 13,750 yuan/ton | -50- |
| Nylon 6.6 chips domestic market | 23,000 yuan/ton | 23,000 yuan/ton | — |
| Nylon6 Filament POY 86D/24F domestic market | 15,400 yuan/ton | 15,400 yuan/ton | — |
| Nylon6 Filament DTY 70D/24F domestic market | 17,400 yuan/ton | 17,400 yuan/ton | — |
| Nylon6 Filament FDY 70D/24F | 16,100 yuan/ton | 16,100 yuan/ton | — |
| Spandex 20D domestic market | 31,200 yuan/ton | 31,200 yuan/ton | — |
| Spandex 30D domestic market | 30,700 yuan/ton | 30,700 yuan/ton | — |
| Spandex 40D domestic market | 28,000 yuan/ton | 28,000 yuan/ton | — |
| Adipic Acid China domestic market | 9,500 yuan/ton | 9,300 yuan/ton | -200- |
| Adipic Acid Europe market | 2,100 $/ton | 2,260 $/ton | +160- |
| Benzene domestic market East China | 8,550 yuan/ton | 8,800 yuan/ton | +250- |
| Benzene CFR China | 1,055 $/ton | 1,123 $/ton | +68- |
| Ethylene South East market | 1,410 $/ton | 1,350 $/ton | -60- |
| Ethylene NWE market CIF | 1,488 $/ton | 1,490 $/ton | +2- |
| Acrylonitrile (ACN) domestic market | 11,150 yuan/ton | 10,900 yuan/ton | -250- |
| Acrylonitrile ACN Southeast Asia | 1,780 $/ton | 1,740 $/ton | -40- |
| Acrylic staple fiber (ASF) CFR China | 16,200 yuan/ton | 16,055 yuan/ton | -145- |
| VSF viscose staple fiber | 13,750 yuan/ton | 13,800 yuan/ton | +50- |
| PP Powder domestic market | 9,200 yuan/ton | 9,250 yuan/ton | — |
| Naphtha overseas market | 933 $/ton | 936 $/ton | +3- |
| Phenol domestic market (Jinan Dezheng / Yanshan Petrochemical, Shandong) | 8,450 yuan/ton | 8,387 yuan/ton | -63- |
| Recycled PET | 4,200 yuan/ton | 4,250 yuan/ton | +50- |
BASF Q1 2026 results show resilience amid global pressure challenges
BASF Q1 2026 results highlight resilience in a volatile market
The BASF Q1 2026 results demonstrate how the global chemical giant managed to stay stable despite a difficult economic and geopolitical environment. While currency headwinds and pricing pressure weighed on performance, solid volume growth helped offset much of the impact.
According to BASF, the first quarter of 2026 reflects a business that is adapting to uncertainty while maintaining operational strength. Growth in China and shifting global demand patterns played a significant role in shaping the quarter.
Strong volumes balance external pressures
A key takeaway from the BASF Q1 2026 results is that volume growth remained solid across most segments. This increase helped counterbalance negative currency effects exceeding €100 million and slightly declining prices in several divisions.
Chief Financial Officer Dirk Elvermann emphasized that without these currency headwinds, earnings would have matched the previous year. This highlights how external macroeconomic factors, rather than operational weaknesses, drove much of the decline.
Sales reached €16.02 billion, slightly below the €16.51 billion reported in the same quarter of 2025. The drop was mainly due to unfavorable exchange rates and competitive pricing pressure across key business areas.
Segment performance shows mixed picture
The BASF Q1 2026 results reveal a mixed performance across business segments. While some areas faced declining earnings, others showed improvement or stability.
Segments such as Chemicals, Agricultural Solutions, and Nutrition & Care recorded lower earnings due to pricing pressure and cost challenges. Meanwhile, Surface Technologies and Materials benefited from improved conditions, including higher precious metal prices.
Industrial Solutions maintained a stable performance, matching last year’s figures. However, the “Other” category experienced a significant decline, reflecting ongoing restructuring and cost optimization efforts.
This uneven performance highlights how different parts of BASF’s portfolio respond differently to global economic shifts.
EBITDA and profitability trends
Profitability remained relatively strong despite the challenging environment. EBITDA before special items reached €2.4 billion, only slightly below the €2.5 billion recorded in Q1 2025.
The EBITDA margin decreased modestly to 14.7% from 15.1% in the previous year. This reflects the impact of pricing pressure and currency effects on overall profitability.
Including special items, EBITDA stood at €2.19 billion. These special charges, totaling €170 million, were mainly linked to cost-saving initiatives, particularly at the Ludwigshafen site.
Despite these factors, EBIT increased to €1.26 billion, up from €1.16 billion in the prior-year quarter. Net income also improved to €927 million, demonstrating underlying financial strength.
Earnings per share rose to €1.06, compared with €0.91 in Q1 2025, reinforcing the positive bottom-line performance.
Cash flow improves but remains seasonal
Cash flow trends in the BASF Q1 2026 results show improvement, although they remain negative due to seasonal factors.
Cash flow from operating activities improved by €185 million to minus €797 million. This improvement was driven by higher net income and increased dividends from equity-accounted investments. One notable contributor was Wintershall Dea GmbH, which provided significantly higher dividend income compared to the previous year.
Free cash flow also improved by €423 million, reaching minus €1.38 billion. Lower capital expenditures on property, plant, and equipment contributed to this positive trend.
It is important to note that BASF typically reports negative free cash flow in the first quarter due to the seasonal nature of its Agricultural Solutions business. Performance usually strengthens as the year progresses.
Dividend strategy remains stable
The BASF Q1 2026 results confirm the company’s commitment to shareholder returns. BASF plans to distribute at least €12 billion between 2025 and 2028 through dividends and share buybacks.
The proposed dividend for the 2025 financial year is €2.25 per share, unchanged from the previous year. This consistent payout reflects confidence in the company’s long-term financial stability.
Shareholders holding BASF stock as of April 30, 2026, are eligible for the dividend, with payment scheduled for May 6, 2026. The ex-dividend date is May 4, 2026.
This stable dividend policy is a key factor for investors seeking reliable income from large industrial companies.
Outlook shaped by global uncertainty
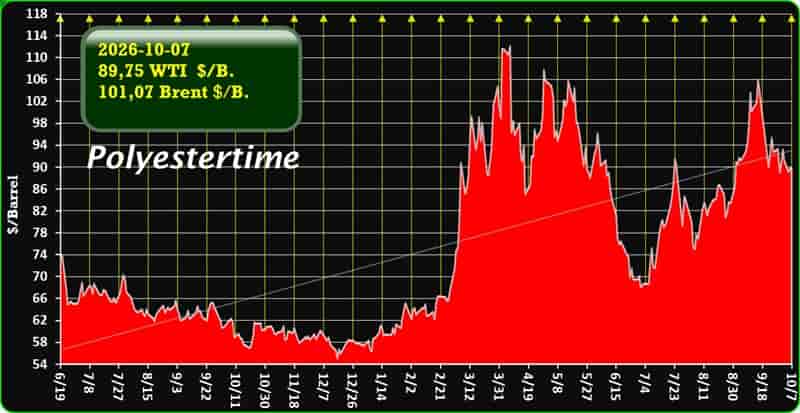
Looking ahead, the BASF Q1 2026 results highlight significant uncertainty in the global economic environment. The ongoing conflict in the Middle East is a major factor influencing energy prices, supply chains, and overall market stability.
BASF has maintained its original assumptions for 2026, including:
- Global GDP growth of 2.7%
- Industrial production growth of 2.3%
- Chemical production growth of 2.4%
- Average exchange rate of $1.20 per euro
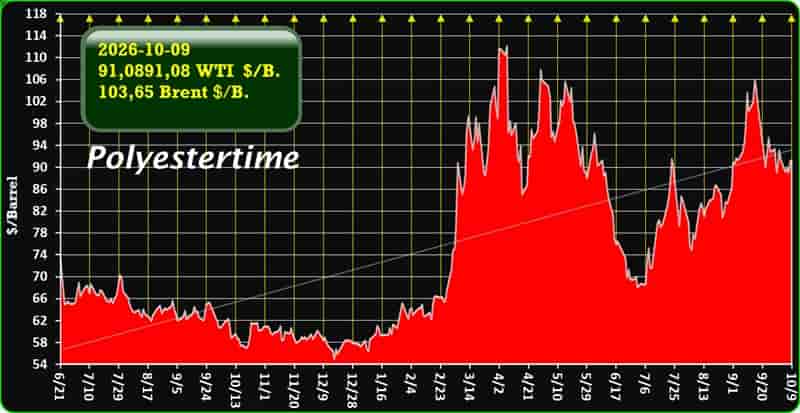
- Oil price of $65 per barrel
However, management acknowledges that these assumptions may be too optimistic given current conditions. Rising oil prices and a potentially stronger U.S. dollar could further impact performance.
Full-year forecast remains unchanged
Despite these uncertainties, BASF has not revised its full-year guidance. The company continues to expect:
- EBITDA before special items between €6.2 billion and €7.0 billion
- Free cash flow between €1.5 billion and €2.3 billion
- CO2 emissions between 17.2 and 18.2 million metric tons
This steady outlook reflects confidence in BASF’s ability to manage risks and adapt to changing conditions.
At the same time, the company is closely monitoring developments related to energy markets and global supply chains. Rapid changes in these areas could significantly affect future performance.
Strategic flexibility becomes critical
The BASF Q1 2026 results underline the importance of strategic flexibility in today’s environment. With geopolitical tensions and economic uncertainty on the rise, companies must be able to respond quickly to changing conditions.
BASF is focusing on cost efficiency, portfolio optimization, and targeted investments to maintain competitiveness. Ongoing restructuring efforts, particularly in Europe, are part of this strategy.
The company’s diversified business model also provides resilience, allowing it to balance weaknesses in some segments with strengths in others.
Shareholder engagement and meeting format changes
BASF is also adapting how it engages with shareholders. Following a successful virtual Annual Shareholders’ Meeting in 2025, the company has decided to alternate between in-person and virtual formats.
Meetings in 2026 and 2028 will be held physically at the Congress Center Rosengarten in Mannheim, while 2027 and 2029 will use a virtual format.
This hybrid approach aims to meet the expectations of a diverse global investor base while maintaining accessibility and efficiency.
Conclusion: BASF Q1 2026 results reflect stability under pressure
Overall, the BASF Q1 2026 results show a company that is navigating a complex global landscape with resilience. While external challenges such as currency fluctuations and geopolitical risks have impacted performance, strong volumes and disciplined cost management have helped maintain stability.
The combination of steady dividends, improved earnings, and a consistent outlook suggests that BASF remains well-positioned for the rest of 2026. However, much will depend on how global economic and political conditions evolve in the coming months.
For investors and industry observers, the BASF Q1 2026 results provide a clear example of how large multinational companies are adapting to uncertainty while continuing to deliver value.
More…