US-Iran War and Oil Prices: Navigating Market Volatility as Brent Trades Near $92 and WTI at $86
US Iran oil prices
US-Iran War and Oil Prices: Navigating Market Volatility as Brent Trades Near $92 and WTI at $86
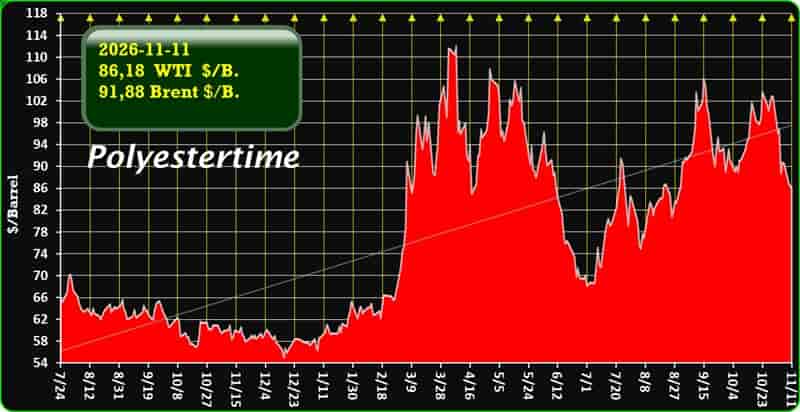
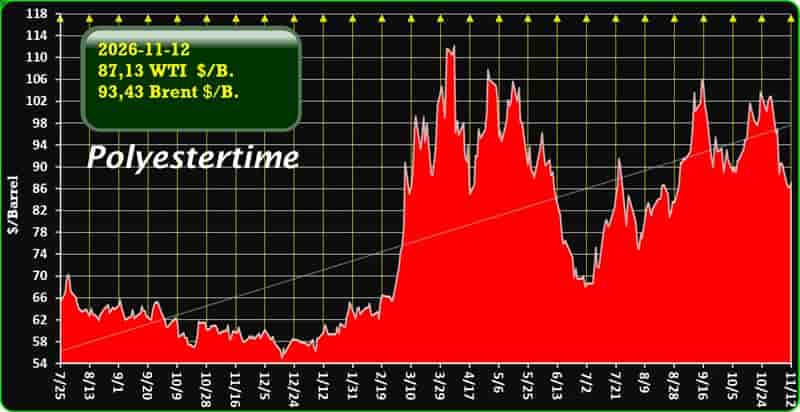
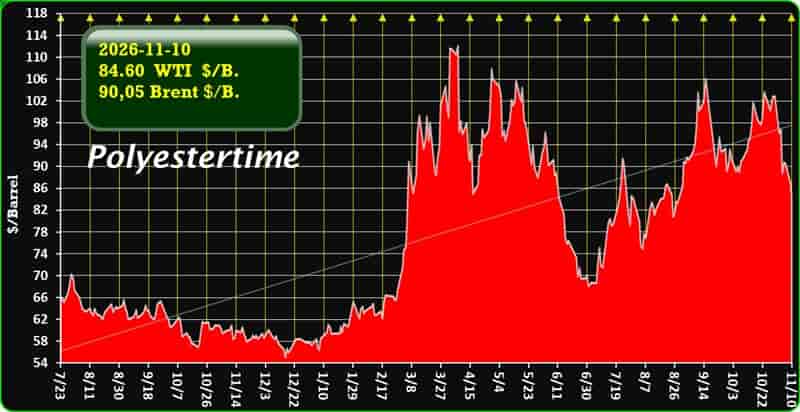
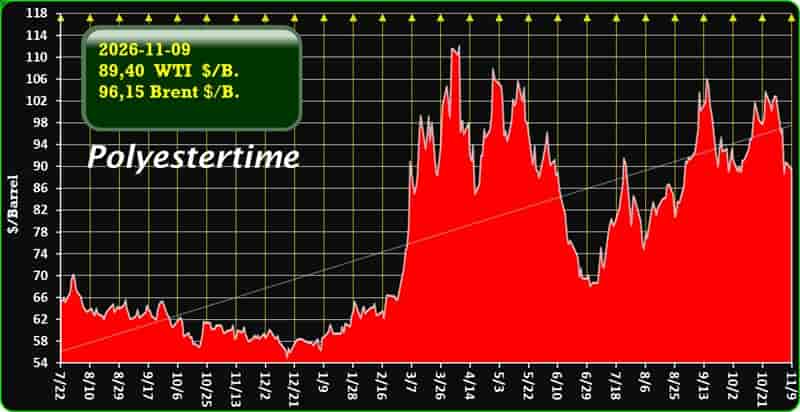
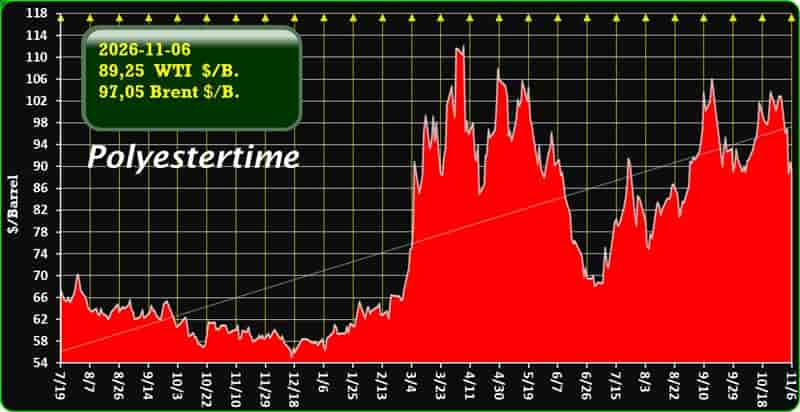
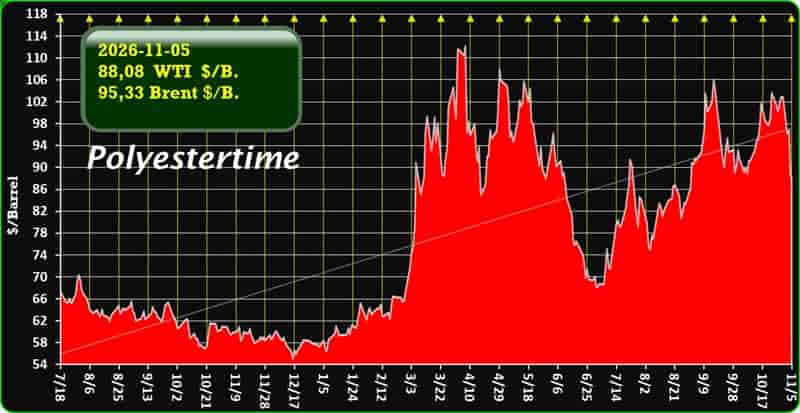
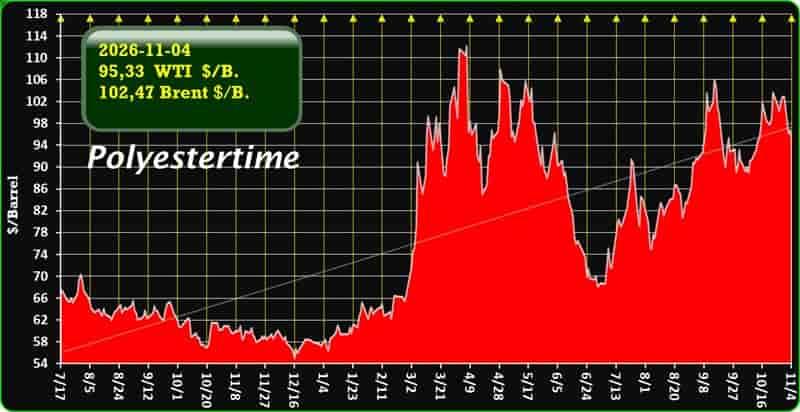
The global energy market continues to navigate profound instability as the geopolitical conflict involving the United States, Israel, and Iran ripples through international supply chains. Following months of extreme price swings—which saw global benchmarks surge toward $120 a barrel in late October—crude markets have experienced a sharp reassessment. International benchmark Brent crude trades near $92 per barrel, while the U.S. standard, West Texas Intermediate (WTI), sits around $86 per barrel.
This recent price consolidation reflects a complex tug-of-war between lingering security risks in critical maritime chokepoints and a growing physical crude surplus in global markets. For energy traders, policymakers, and consumers alike, understanding the drivers behind these price benchmarks is essential for anticipating the next phase of the global economic outlook.
The Dynamic Behind Current Benchmark Levels
The price relationship between Brent crude and WTI serves as a crucial barometer for global market health. Under standard conditions, Brent commands a modest premium over WTI, primarily reflecting transport costs to global refining hubs. During periods of acute geopolitical crisis, however, this spread widens significantly as seaborne crudes absorb higher risk premiums. US Iran oil prices
When tension in the Middle East reached its peak, Brent crude spiked above $118 per barrel. The current retreat to $92/B for Brent and $86/B for WTI reflects market relief over diplomatic signaling, yet prices remain substantially elevated compared to pre-conflict levels.
De-escalation Signals vs. Maritime Vulnerabilities
The primary driver behind the recent drop from record highs has been political messaging from Washington. Recent White House statements downplaying the need for immediate, large-scale direct strikes against Iranian targets have effectively stripped a portion of the fear-driven premium out of crude futures.
Despite political rhetoric suggesting a potential path toward cooling hostilities, conditions on the water tell a more cautious story:
-
Strait of Hormuz Security: The Strait of Hormuz remains a critical bottleneck. While total blockade has been avoided, recurring vessel targeting and maritime drone incidents keep transit risks high.
-
War-Risk Insurance Costs: Tanker insurance rates for Persian Gulf transits remain elevated at 6% to 10% of hull value. This adds multi-million-dollar surcharges to single voyages, preventing physical crude prices from dropping back to baseline pre-war averages.
-
Diplomatic Resistance: Iranian security officials continue to express skepticism regarding formal truce negotiations, highlighting the fragile foundation of the current market lull.
Underlying Fundamentals: Supply Surpluses Weighing on Energy
While geopolitical risks typically create upward pressure on energy commodities, physical supply-and-demand fundamentals are exerting a strong downward pull on futures.
Several key structural developments have prevented crude from sustaining three-digit price targets:
-
Expanding Production Outside the Conflict Zone: Latin American crude production has expanded notably year-over-year, while Non-OPEC+ output—led by the United States, Brazil, and Guyana—continues to add daily volume to sea routes.
-
OPEC Production Increases: Core OPEC producers have gradually restored export volumes, lifting Middle Eastern daily exports significantly off their springtime low points.
-
Demand Destruction: Sustained high energy and fuel costs over recent months have weighed on global industrial activity. Global demand growth has slowed, leaving market analysts to estimate an active physical surplus of 1.1 to 1.4 million barrels per day.
Economic Implications for Global Business and Inflation
The stabilization of Brent near $92/B and WTI near $86/B offers temporary respite to central banks and consumer economies, but elevated fuel costs continue to filter down through key supply chains.
┌──────────────────────────────────────────────────────────┐
│                   CRUDE OIL PRICE WAVE                   │
│                                                          │
│   Peak Crisis ($118/B) ────────┐                         │
│                                │                         │
│                                ▼                         │
│                    Current Levels ($86-$92/B)            │
│                                │                         │
│          ┌─────────────────────┴─────────────────────┐   │
│          ▼                                           ▼   │
│  Agricultural Inputs                      Freight & Logistics │
│  (Diesel & Nitrogen Fertilizers)          (Surcharges & Insurance) │
└──────────────────────────────────────────────────────────┘
The agricultural and transport sectors remain directly affected. Commercial farmers face high diesel and fertilizer expenses, keeping food production costs inflated. Similarly, global shipping lines must balance high bunker fuel costs with war-risk premiums, ensuring that downstream consumer price indexes remain sensitive to market shifts.
Market Outlook: Key Scenarios for Traders and Investors
Looking forward, oil prices will fluctuate based on the resolution of political talks versus actual physical shipping stability in the Middle East. Analysts outline two primary trajectories for crude prices heading into early 2027:
Scenario 1: The Bearish Surplus Realization
If diplomatic channels remain open and attacks on commercial vessels in the Gulf decline, maritime insurance rates will begin to normalize toward historical averages. Combined with the projected 1.4 million barrel-per-day market surplus, this outcome would likely push Brent crude down toward the $75–$80 range, with WTI settling closer to $70–$75.
Scenario 2: Renewed Escalation and Chokepoint Disruption
Should formal negotiations stall or regional military activity target critical refining infrastructure or export terminals, the geopolitical risk premium will re-emerge rapidly. Investment bank scenarios warn that severe, prolonged disruptions in Persian Gulf transit routes could push Brent back past $110, with tail-risk models extending toward $140 per barrel under sustained loss of Middle Eastern supply.
Strategic Takeaways for Energy Planning
For organizations, investors, and procurement managers, navigating the current US-Iran oil environment requires managing ongoing volatility. Key priorities include:
-
Monitoring the Brent-WTI Spread: A narrowing spread indicates easing maritime transit risks, while a widening spread signals rising costs for seaborne international crude.
-
Hedging Against Fuel Volatility: Businesses heavily reliant on transportation or agricultural inputs should evaluate options to lock in prices around current benchmark levels rather than banking on a complete market collapse.
-
Tracking Physical Inventory Reports: U.S. commercial crude and distillate inventory data provide essential indicators for domestic demand strength and buffer capacity against external supply shocks.
While current prices near $92/B for Brent and $86/B for WTI represent a stabilization compared to previous spikes, energy markets remain tightly bound to geopolitical events. Decision-makers must remain vigilant as headlines dictate daily price shifts.
Global Oil Markets and the US-Iran Conflict: Navigating Price Volatility in 2026
More…